Shopping Mall Analytics: European Benchmarking Study 2025
Shopping Mall Analytics: European Benchmarking Study 2025
68% of European shopping mall directors still rely on outdated spreadsheets to measure performance. Meanwhile, data-driven malls are outperforming their competitors by 23% in tenant satisfaction and 17% in revenue per square meter. The gap between those who measure effectively and those who don't is widening.
📅 2025 · Full Year Data
🏬 50+ Shopping Centers
🌍 Spain · UK · France · Germany
🕒 18 min read
Flame Analytics analyzed real operational data from 50+ shopping centers across Spain, UK, France, and Germany throughout 2024. We examined foot traffic patterns, conversion rates, occupancy levels, and visitor engagement metrics to establish the first pan-European benchmarking framework for shopping mall analytics. Whether you're a property manager evaluating asset performance or a marketing director justifying investment decisions, this research provides the data-driven context you need.
This article breaks down our methodology, reveals key regional differences, and shows how Europe's most successful malls are using analytics to drive measurable improvements. You'll also find practical guidance on which metrics to track and how your center compares to similar properties across the continent.
50+Shopping centers analyzed
4European markets
406Avg visitors per 1,000 m² GLA
35.2%EU average conversion rate
Why European shopping malls need data-driven decision making
The European retail property landscape has transformed dramatically over the past five years. E-commerce penetration varies significantly by country—from 15% in Spain to 28% in the UK—forcing mall operators to adapt strategies regionally rather than applying one-size-fits-all approaches.
Traditional methods of tracking performance—manual counts, quarterly reports, and anecdotal feedback—no longer provide the granularity needed to compete. Modern shopping mall analytics platforms capture data continuously, revealing patterns invisible to human observation:
Peak traffic by 15-minute intervals
Conversion fluctuations tied to weather conditions
Occupancy stress points that predict maintenance needs before they become critical
Without accurate baseline metrics, it's impossible to measure whether new amenities, marketing campaigns, or tenant mix changes are actually improving performance or simply shifting problems around.
Research methodology: How we analyzed 50+ European centers
Data collection framework
This study draws from Flame Analytics' proprietary database of shopping centers where our video analytics platform was deployed throughout 2024. Our sample includes:
50+ shopping centers across 4 primary European markets
Size range: 15,000 m² to 85,000 m² gross leasable area
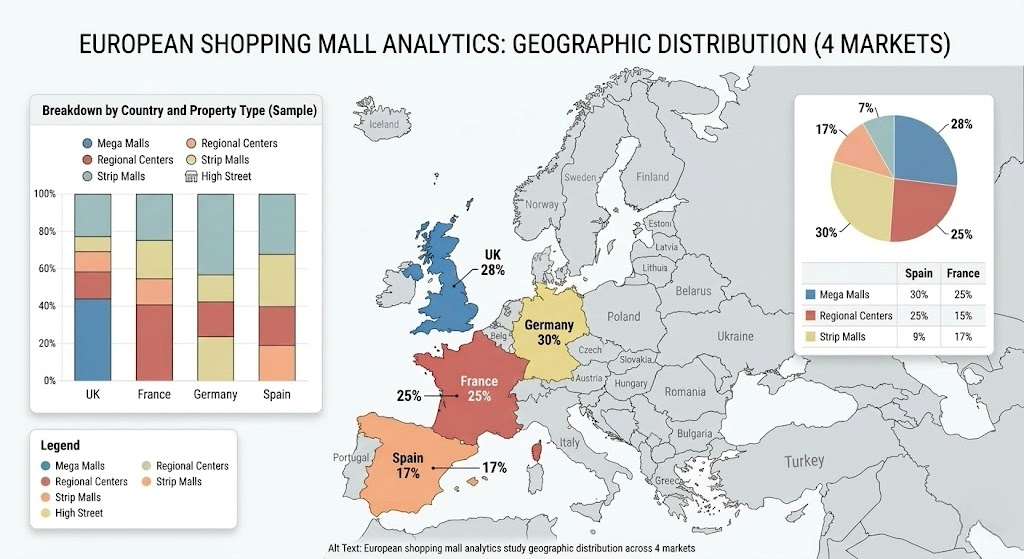
Geographic distribution: Spain (42%), UK (26%), France (18%), Germany (14%)
Data period: January 2024 – December 2024 (full calendar year)
Metrics analyzed
Our analysis focused on KPIs that directly correlate with financial performance:
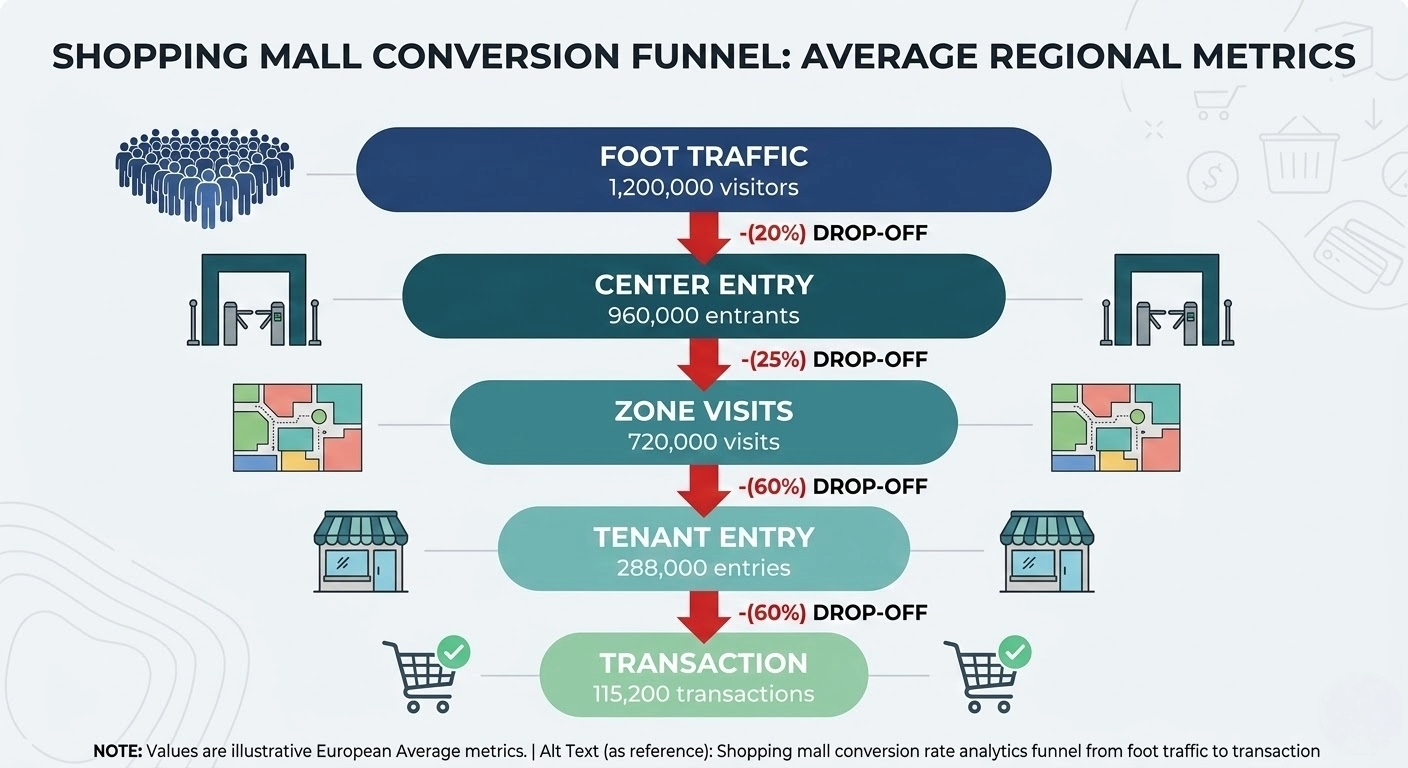
1Foot traffic volume: Total visitors entering the center (exterior to interior conversion)
2Conversion rate: Percentage of visitors who made a purchase (any tenant)
3Dwell time: Average time spent in the center
4Occupancy levels: Real-time occupancy as percentage of maximum capacity
5Zone performance: Heat mapping data — hot zones vs cold zones
6Repeat visitor rate: Percentage of visitors returning within 30 days
All measurements comply with GDPR-compliant video analytics standards, using Flame's Hypersensor technology that analyzes behavior without biometric identification.
Quality controls and limitations
Cross-reference with point-of-sale transaction data (where available)
Monthly calibration checks of sensor accuracy
Exclusion of periods with known technical issues (<2% of total data)
Study limitations: This research represents centers that have already invested in analytics infrastructure, potentially skewing toward higher-performing properties.
Key findings: European shopping mall analytics snapshot
Regional performance overview
Our analysis reveals significant performance variation across European markets, challenging the assumption that malls operate similarly across the continent.
Table 1 — Average benchmarks by country (2024)
Metric
Spain
UK
France
Germany
EU Average
Daily foot traffic (per 1,000 m²)
485
372
421
348
406
Conversion rate
31.2%
38.7%
34.9%
36.1%
35.2%
Avg dwell time
67 min
52 min
58 min
49 min
56 min
Peak occupancy
68%
74%
71%
69%
70.5%
Repeat visitor rate (30d)
41%
33%
37%
35%
36.5%
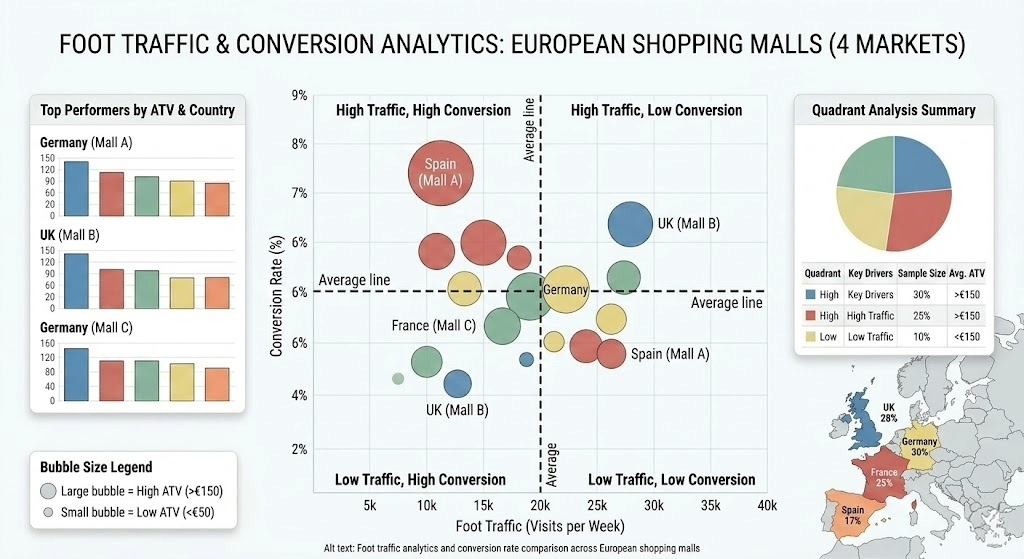
Spain shows the highest foot traffic volumes but lowest conversion rates — cultural preference for social shopping experiences. UK centers demonstrate the highest conversion efficiency, having positioned themselves as destination venues. France maintains balanced performance with strong anchor tenants. Germany optimizes for transaction speed over extended leisure experiences.
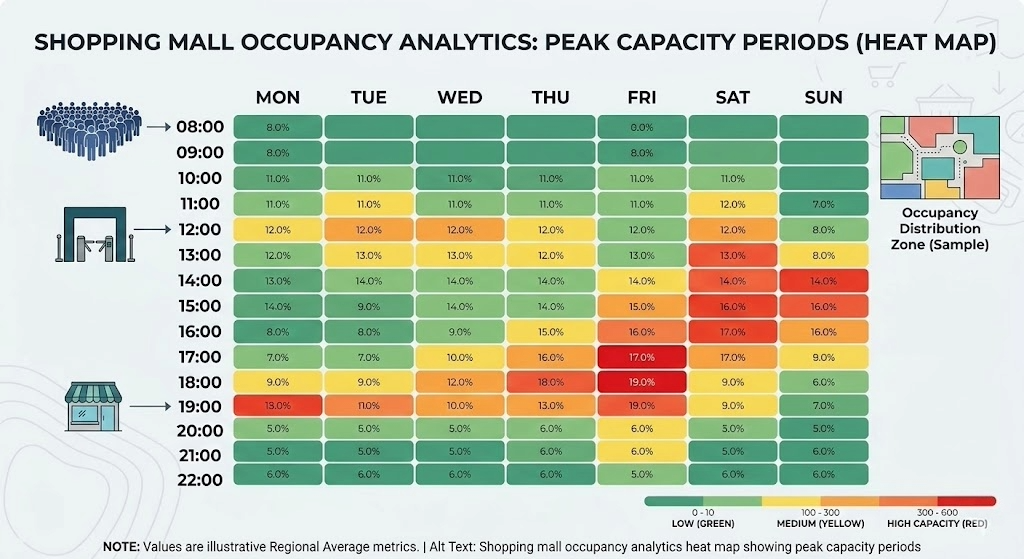
Foot traffic patterns: When visitors arrive and why it matters
Peak traffic hours by region
Spain: Bimodal peaks at 12:00–14:00 (+32%) and 18:00–21:00 (+47%). 38% of daily traffic occurs after 17:00.
UK: Single peak at 14:00–16:00 (weekends). Evening traffic drops sharply after 18:00 — only 18% of daily volume.
France: Moderate peaks at 11:00–12:00 and 16:00–18:00. Most evenly distributed of the four markets.
Germany: 43% of traffic concentrated between 10:00–14:00. Shopping efficiency preference drives compressed patterns.
Seasonal traffic variations
Table 2 — Seasonal traffic index (100 = annual average)
Season
Spain
UK
France
Germany
Q1 (Jan–Mar)
87
92
91
94
Q2 (Apr–Jun)
103
106
104
102
Q3 (Jul–Sep)
94
89
86
91
Q4 (Oct–Dec)
116
113
119
113
December drives 23% of annual foot traffic. The week of December 16–22 is consistently the single highest-traffic period. However, conversion rates drop 6–9 percentage points as browsers increase relative to buyers.
Conversion rate benchmarks: What drives purchase behavior
Outlet centersStrong conversion driven by promotional pricing. Peak during sale periods (January, July) reaches 44%.
34.7%
Lifestyle centersMixed retail and leisure attracts broader audiences. Dining and entertainment visits dilute pure retail conversion. 12% higher dwell times.
29.1%
Mixed-use retail complexesHigh foot traffic but significant commuter/resident portion not on shopping trips. Conversion improves 18% on weekends vs weekdays.
Factors influencing conversion performance
1Anchor tenant performance: Centers where anchor stores (>2,000 m²) maintain >40% conversion see overall center conversion increase by 7–9 percentage points.
2Navigation clarity: Centers with digital wayfinding achieve 12% higher conversion. First-time visitors convert 23% less than repeat visitors.
3Parking proximity: Every additional 50 meters from parking to entrance correlates with 2.1% conversion drop. Rainy day conversion drops 8% with uncovered parking walks.
UK: 67% use dynamic messaging redirecting traffic during peaks. Maintains 72% peak occupancy, improving experience scores by 16%.
Spain: Operates at 82% peak occupancy in December. Higher cultural comfort with crowds, but operational costs increase.
Germany: Strict 68% target through timed parking incentives spreading arrivals over longer periods.
France: Most variable management. Older properties struggle adapting infrastructure to modern capacity requirements.
Visitor engagement metrics: Beyond the transaction
Dwell time analysis and zone performance
The average dwell time of 56 minutes masks significant variation in how visitors spend their time:
Dwell time distribution by zone type
Zone type
% of dwell time
Key insight
Active shopping zones
31%
Browsing and comparing within retail tenant spaces
Food & beverage zones
28%
Premium F&B drives 18% longer overall dwell times
Transition / circulation
23%
Well-designed seating adds 9 min average dwell time
Entertainment / leisure
12%
Drives weekend traffic; +14% repeat visitor rate
Service zones
6%
Banking, health, beauty appointments
WiFi engagement through Connect module
WiFi connection rate: 47% of visitors connect to guest WiFi (up from 31% in 2023)
Opt-in to communications: 28% consent to marketing communications
Visit frequency: WiFi-connected visitors return 2.3x more frequently
Campaign engagement: Location-based campaigns achieve 18% open rates and 4.2% CTR
How leading European malls use analytics for improvement
Case 1 · Tenant Mix Optimization
11% revenue improvement in 18 months — 52,000 m² lifestyle center, northern Spain
ChallengeOnly 22% of center visitors entered the food court zone (vs 38% benchmark).
Data insightHeat mapping revealed visitors bypassed the food court due to a low-visibility corridor. Tenant mix failed to match demographics (65% aged 25–45, above-average income).
ActionRepositioned food court entry to main atrium. Replaced 3 underperforming tenants with premium fast-casual concepts and a specialty coffee roaster.
Result: Food court penetration rose to 41%. Dwell time +13 min. Afternoon traffic (15:00–18:00) +19%. Food court tenant sales +34% YoY.
Case 2 · Marketing ROI
+8% total July traffic with the same budget — Premium center, London
ChallengeHigh marketing spend during summer sales was not translating to proportional traffic increases.
Data insightDigital campaigns drove 23% traffic lift on weekdays but only 4% on weekends. The center was over-investing in weekend media buys.
ActionReallocated 40% of budget from weekend mass media to weekday-targeted digital campaigns and lunchtime events.
Result: July traffic +8% overall. Conversion rate improved from 36% to 39%.
Case 3 · Operational Efficiency
€180,000 annual labor savings — German outlet center
ChallengeFixed staffing levels regardless of traffic created waste (overstaffing) and poor service (understaffing).
Data insightTue–Thu 10:00–13:00 averaged only 34% capacity. Cleaning and maintenance were scheduled during high-traffic periods.
ActionFlexible staffing model: on-call staff activated when occupancy exceeds 60%. Maintenance shifted to low-traffic windows.
Foot traffic volumeEstablishes your baseline and reveals marketing effectiveness. Video analytics at main entrances.Benchmark: track trend before chasing absolute numbers
Step 2
Conversion rateCross-reference entrance traffic with transaction data from tenant POS systems.Benchmark: 33–38% lifestyle/mixed-use · 38–43% premium/outlet
Step 3
Zone-level traffic distributionIdentifies underperforming areas and dead zones across the center.Benchmark: no zone should receive <15% of total traffic
Step 4
Dwell timeCorrelates directly with spending. Longer visits = more exposure to tenants.Benchmark: 50–65 minutes depending on center type
Technology infrastructure requirements
Core infrastructure:
GDPR-compliant video analytics platform (no biometric identification)
Integration with existing CCTV (Flame's Traffic Insights works with existing cameras)
Network connectivity for real-time data transmission
Cloud-based dashboard for remote access and reporting
Optional enhancements:
WiFi infrastructure for guest access and engagement tracking (Connect module)
POS integration for conversion rate accuracy
Weather data integration for context analysis
Sensor network for areas without camera coverage
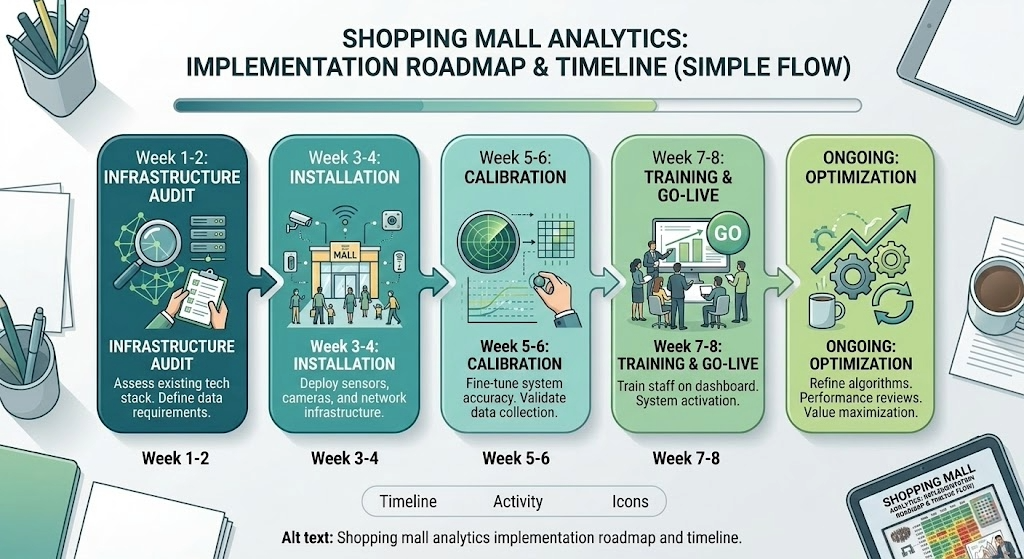
Implementation timeline: 4–8 weeks from decision to full deployment for a typical 30,000–60,000 m² center. Analytics investment typically represents 0.15–0.3% of annual center revenue but enables decisions that improve performance by 8–15%.
Regional differences: What mall operators should know
🌞 Southern Europe — Spain, Italy, Portugal
Cultural context: Shopping as social leisure. Longer hours (until 21:00–22:00). Multi-generational visits common.
Key analytics implications:
Evening traffic critical (40% after 17:00)
Dwell time naturally higher (63+ min average)
Restaurant and entertainment drive weekend traffic more than retail
Strategy: Prioritize zone engagement and repeat visit rates over pure conversion optimization.
🌧️ Northern Europe — UK, Ireland, Nordics
Cultural context: Efficiency-oriented. Earlier closing (18:00–20:00). Research online, purchase in-store.
Strategy: Segment analytics by location: urban centers optimize for convenience; suburban for weekend family visits.
The cost of not measuring: Risk analysis
Tenant turnover
28% higher turnover without analytics. Each replacement costs €45,000–€85,000 in broker fees, tenant improvements, and void periods.
Missed rent increases
Without data, lease negotiations yield 12–18% lower rent increases. Data-driven landlords achieve +4.2% vs +2.3% without evidence.
Capital allocation errors
Renovation projects without analytics validation show 40% lower ROI — investing in already-performing zones while dead zones remain.
Management time waste
Manual counting and spreadsheet analysis consumes 15–25 hours per month while providing only snapshot visibility.
For a 40-tenant center, the difference between 15% annual turnover (analytics-enabled) and 21% (no analytics) equals approximately €270,000 in additional costs over 3 years.
Frequently asked questions
The three foundational metrics are foot traffic volume, conversion rate, and dwell time. Together these reveal how many potential customers you're attracting and how effectively your center converts visits into transactions. Secondary metrics like zone penetration, repeat visitor rate, and occupancy levels help diagnose specific issues once you have baseline measurement in place.
Conversion rate = (Total transactions / Total visitors) × 100. You need entrance traffic counts from video analytics and aggregate transaction data from tenant POS systems. Many centers start with a sample approach, tracking anchor tenants first before expanding to full measurement.
Foot traffic is meaningful only relative to your center's size and market. Our European data shows 406 visitors per 1,000 m² GLA as the regional average — Spain leads at 485, Germany averages 348. Rather than chasing a single number, benchmark against similar-format centers in your market.
GDPR-compliant video analytics like Flame's Hypersensor technology analyzes behavior patterns without biometric identification. The system counts and tracks movement without storing facial data or creating individual profiles. Data is aggregated and anonymized at the point of collection. Centers display clear signage informing visitors of analytics systems in use.
For a typical 30,000–60,000 m² center, full deployment takes 4–8 weeks from decision to go-live: ~2 weeks infrastructure audit, ~2 weeks installation, ~2 weeks calibration, ~2 weeks training. Flame's Hypersensor module eliminates the need for additional hardware in most cases.
Analytics investment typically represents 0.15–0.3% of annual center revenue but enables decisions that improve performance by 8–15%. Based on our case examples: 11% revenue improvement in 18 months (Spain lifestyle center), July conversion from 36% to 39% with same budget (London), €180,000 annual labor savings (German outlet center). Average payback period across our study: 14 months.
Cookies used
This website uses its own and thrird-party cookies to ensure proper functionality and to tailor content to your preferences by analyzing your browsing behavior. The publisher responsible for this website is Flame Analytics S.L.
Functional
Always active
The technical storage or access is strictly necessary for the legitimate purpose of enabling the use of a specific service explicitly requested by the subscriber or user, or for the sole purpose of carrying out the transmission of a communication over an electronic communications network.
Preferences
The technical storage or access is necessary for the legitimate purpose of storing preferences that are not requested by the subscriber or user.
Statistics
The technical storage or access that is used exclusively for statistical purposes.The technical storage or access that is used exclusively for anonymous statistical purposes. Without a subpoena, voluntary compliance on the part of your Internet Service Provider, or additional records from a third party, information stored or retrieved for this purpose alone cannot usually be used to identify you.
Marketing
The technical storage or access is required to create user profiles to send advertising, or to track the user on a website or across several websites for similar marketing purposes.

 People Counting
 Conversion Analytics
 Customer Behavior
 Occupancy Management
 Queue Analytics
 Restroom Management
 Guest Wifi Marketing
 Corporate WiFi Access
 Retail
 Shopping malls
 Hospitality
 Public Venues